|
Broadcasting Industry Key Figures
The following data—collected until 2013—provides an overview of the industry and recent developments.
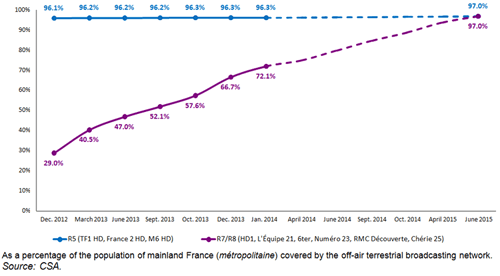
1. HD DTT Coverage
2. Modes of Television Reception on Television Sets over Time
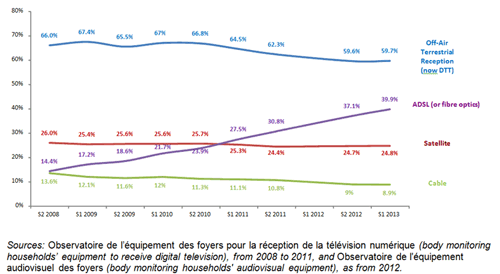
DTT remains the primary television reception mode for 6 households out of 10; 80% have an HD DTT adapter.
The rise of ADSL continues: 4 households out of 10 have it.
3. Single vs. Several TV Set(s) in the Home
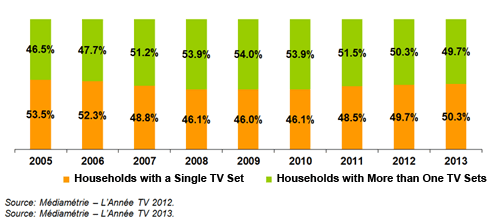
In 2012, almost every French household (97.6%) had at least one TV set. A little over half had more than one; however, the number of households with several TV sets has been decreasing over the last three years.
4. Television Viewing Time per Person
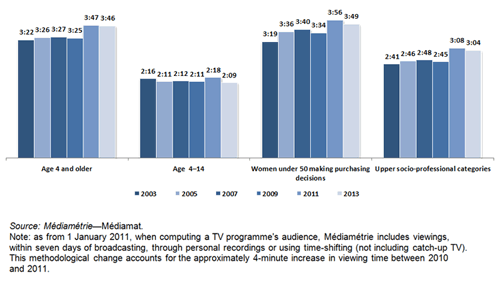
In 2013, in France, viewers watched an average of 3 hours and 46 minutes of television per day; namely, 4 minutes less than in 2012, and one minute less than in 2011.
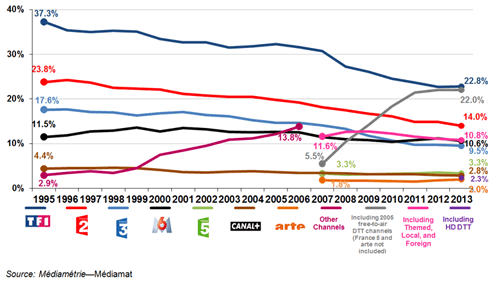
5. Audience Share of TV Channels since 1995
Three major trends emerge:
- 'incumbent' off-air channels losing audience shares throughout the period;
- between 1995 and 2004, expansion of cable and satellite channels (+8 points in audience share);
- rapid growth of the new free-to-air DTT channels (local channels not included) since their launch in 2005, reaching an audience share of 22% in 7 years; stabilising since 2011.
6. Mainstream Media's Advertising Market Shares over Time
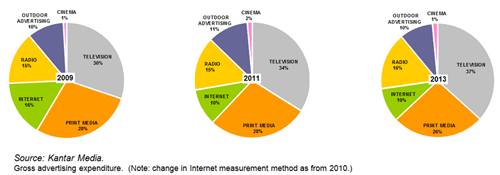
Between 2009 and 2013, television has confirmed its position as the primary medium; before print media, whose share has significantly decreased; and radio, which has maintained its position.
7. Gross Advertising Market Shares over Time by Television Channel Category
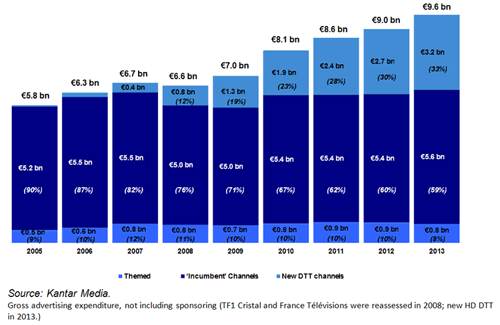
In 2013, the growth in advertising expenditure (+7% compared to 2012) benefited the new DTT channels (+18%)—thanks in particular to the six new HD channels launched in 2012—, and 'incumbent' channels (+4%).
However, between 2012 and 2013, advertising expenditure on pay-TV themed channels decreased by 11%.
8. Types of Radio Receiving Devices
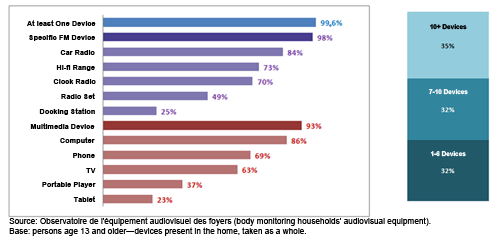
In the first half of 2013, each household had on average 9.6 different devices with radio receiving capabilities (on the FM band, on the Internet, etc.).
35% of those age 13 and older had more than 10 'radio' devices.
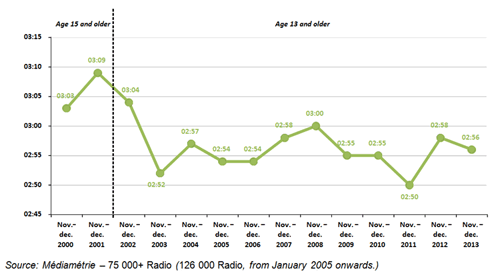
9. Radio Listening Time per Listener
At 2 hours and 56 minutes, from 2 hours and 58 minutes, the average radio listening time of those age 13 and older decreased by 2 minutes, between end of 2012 and end of 2013.
10. Aggregate Audience Shares of the Main National Radio Groups and of group 'Les Indés Radios' over the Last Three Years
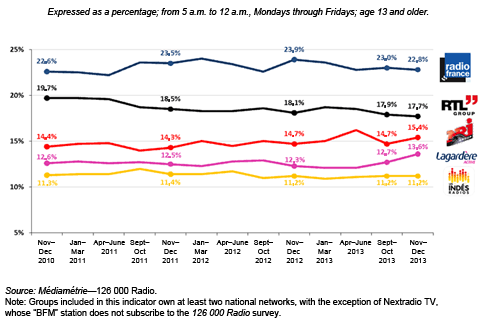
The aggregate audience shares of the various radio groups and of group 'Les Indés Radio' are calculated by adding their respective stations' audience shares.
11. Catch-Up TV
12. Video On-Demand (VOD)
13. Radio Podcasting
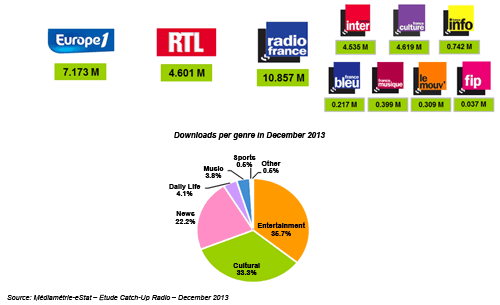
In December 2013, in mainland France (métropolitaine), 22.6 million podcasts were downloaded.
14. Broadcasting on the Internet

|