|
Key 2009 Figures in the
French Broadcasting Industry
The data presented below give a quick overview of: the industry’s position at the end of 2009, recent changes, and emerging trends.
NUMBER OF TELEVISION(S) PER HOUSEHOLD
Almost all French households have at least one television set (98.5% in 2009). The number of households having more than one television is increasing.
AVERAGE VIEWING TIME PER PERSON PER DAY
In 2009, every person residing in mainland France and having at least one television set, has watched an average of 3 hours and 25 minutes of TV per day*.
DTT COVERAGE EXPANSION
INCREASE IN DTT EQUIPEMENT
At the end of 2009, 12,900,000 French households had at least one DTT set top box, namely, 48% of households having a television set.
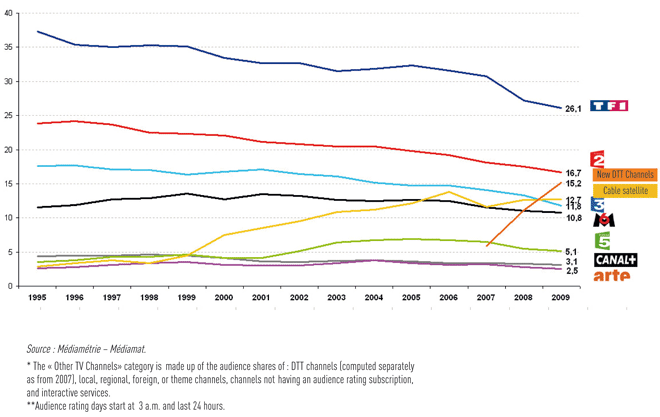
AUDIENCE SHARE OF TV CHANNELS SINCE 1995
The audience share of “incumbent” off-air channels continues to decrease, while the “alternative supply”, made up, in particular, of DTT channels -accounted for in the “Other TV Channels” category- continues to increase (+ 4.2 audience share points in 2009).
Since January 2007, in the « Other TV Channels»* category, Médiatrie computes free-to-air DTT channels separately from other theme, regional, local, and foreign channels. Totalling 17.9% in December 2009, from 8.9% in January 2007, the audience share of free-to-air DTT channels has increased by 100% in two years.
Monday-Sunday, 03:00 – 27:00**, Individuals age 4+ 
CHANGES IN MAINSTREAM MEDIA ADVERTISING MARKET SHARES
The print media, external advertising, and, to a lesser extent, radio and television suffered from the rapid Internet increase between 2005 and 2009.
CHANGES IN ADVERTISING MARKET SHARES BY TV CHANNEL CATEGORIES
For new free-to-air channels, the launch of DTT resulted in a rapid increase in advertising revenue (+223% between 2007 and 2009) to the detriment of incumbent national channels
(-10% over the same period), as well as, cable and satellite theme channels (-8%).
RADIO LISTENING TIME PER PERSON
CHANGES OVER A TWO-YEAR PERIOD IN THE AUDIENCE SHARE OF THE MAIN NATIONAL RADIO GROUPS
Audience share: share of one group’s radio stations’ listening volume in the overall radio listening volume (Monday-Friday, 05:00 – 24:00)

|